By Maicy Vossen, University of Minnesota
A recent WinterTurf blog post from Jessica Till reveals the importance not only of detailed weather data, but also data describing the microclimate beneath turfgrass stands. This robust data collection allows us to understand the unique environmental type, or envirotype, that turfgrass is growing in and to determine which envirotypes are most likely to incur winter damage.
To better detail the envirotype in which a collection of 100 perennial ryegrass accessions are being grown to evaluate of winter hardiness in three locations (Minnesota, Massachusetts and Norway), we are gathering data from weather stations and temperature loggers buried beneath the soil. This perennial ryegrass nursery is being utilized not only for evaluation of more winter hardy accessions, but also to develop a high-throughput phenotyping methodology to predict winter damage.
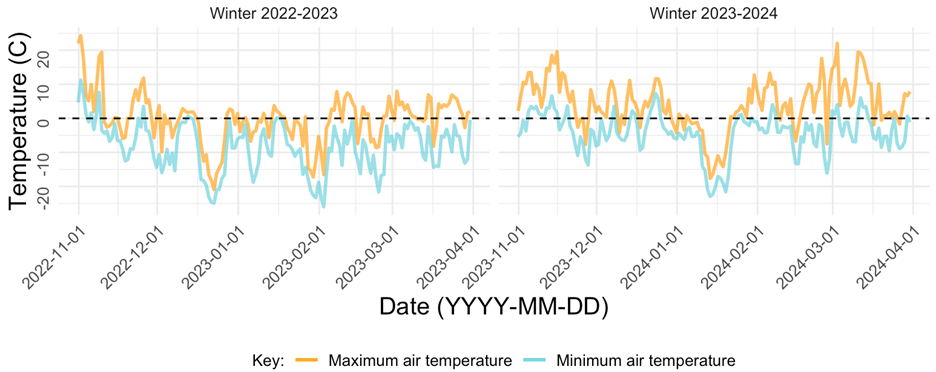
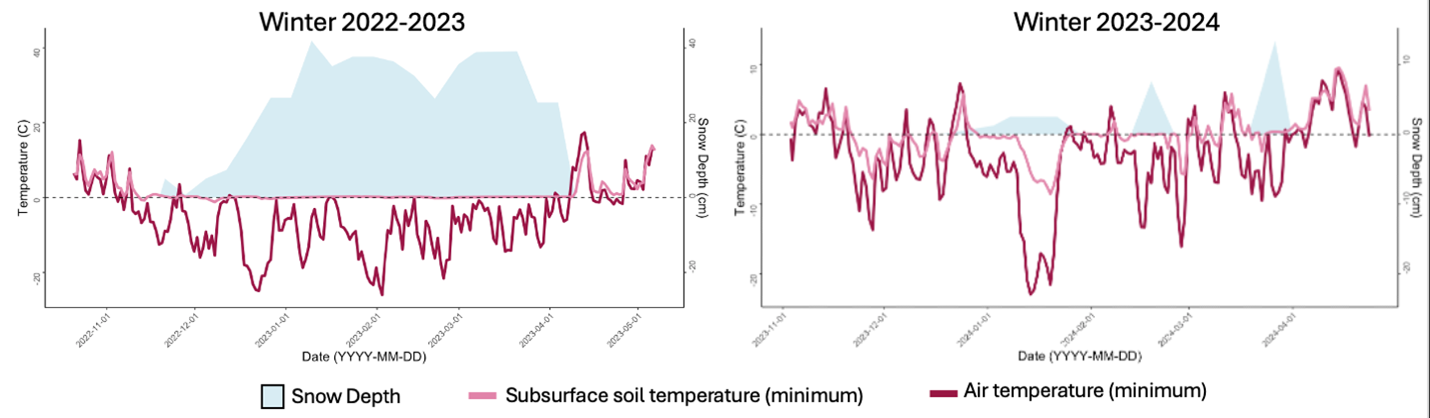
When only comparing the air temperatures of the past two winters in St. Paul, Minnesota, USA, it is hard to tell if there was a difference between the two winters’ environmental conditions (Figure 1). We can see that there is some difference in the two winters’ air temperatures. When adding additional data from subsurface soil temperature sensors and snow depth, we get a new perspective as to the envirotype of the perennial ryegrass nursery (Figure 2). Figure 2 allows us to clearly see that as the air temperature fluctuated well below zero (freezing), the soil temperature barely dropped below freezing in the winter of 2022-2023. The winter of 2023-2024 also had temperature fluctuations well below zero, except with little snow cover, and the soil temperatures also dropped below freezing. This is critical when we consider freeze damage to perennial ryegrass during winter is greatly impacted by the temperature the crown of the plant is exposed to. The crown of perennial ryegrass is situated near the soil surface, which is why soil temperature is recorded to get a full picture of the envirotype the plant is growing in.
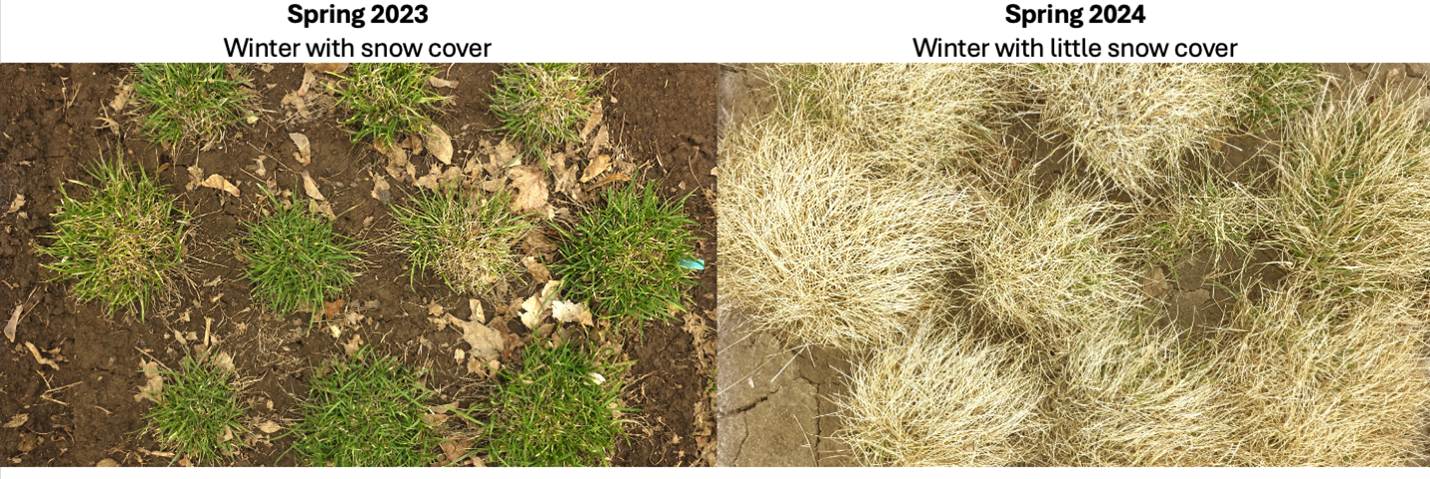
Clearly, not every winter is the same, which also means that not every spring is the same. When comparing the condition of perennial ryegrass in the spring of 2023 and 2024, we can see that there is clearly a difference in survival (Figure 3). It is unclear whether the drastic difference in survival is entirely due to winter damage, or if the age of the perennial ryegrass plants played a role in survival. However, the envirotype of the plants cannot be ignored when trying to predict winter injury.