By Stefan Liess, University of Minnesota
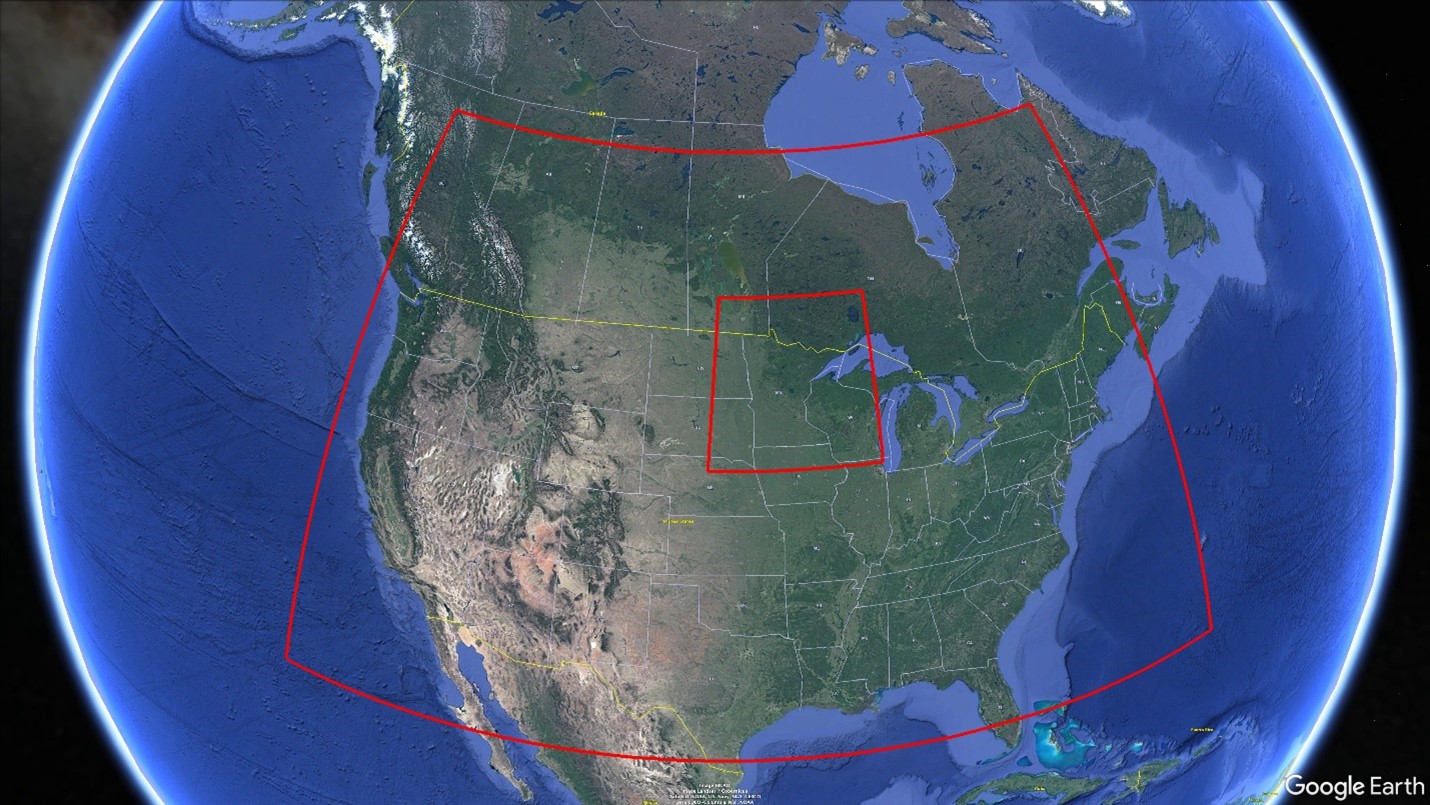
As part of the WinterTurf project, we are analyzing present and potential future climate conditions over regions containing golf courses in northern US states. Here we show results from our use of a high-resolution climate model over the state of Minnesota (inner red box in Figure 1) to predict typical climate conditions during future winters. The projected climate in the surrounding region (outer red box in Figure 1) comes from six global projections that were performed at six international climate research centers. Using the average of a multitude of projections reduces the uncertainty of an individual projection and therefore leads to a more stable result.
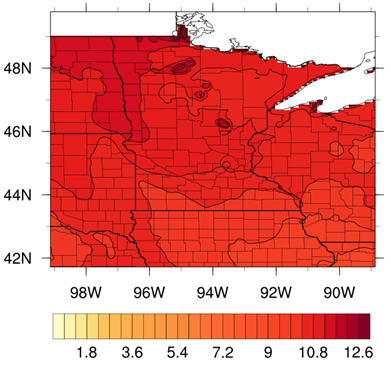
Our current projections indicate a strong warming during winter in the northern Midwest. This is partly due to a chain reaction, also known as a positive feedback loop: 1) warming increases snow melt, 2) a darker surface with less snow cover enhances surface heating, which in turn warms the atmosphere, and so on. Our initial results show a winter warming of up to 11F near the surface by the end of the 21st century, especially over lakes where ice-free water bodies can store much more heat than the previously ice-covered lake surfaces (Figure 2).
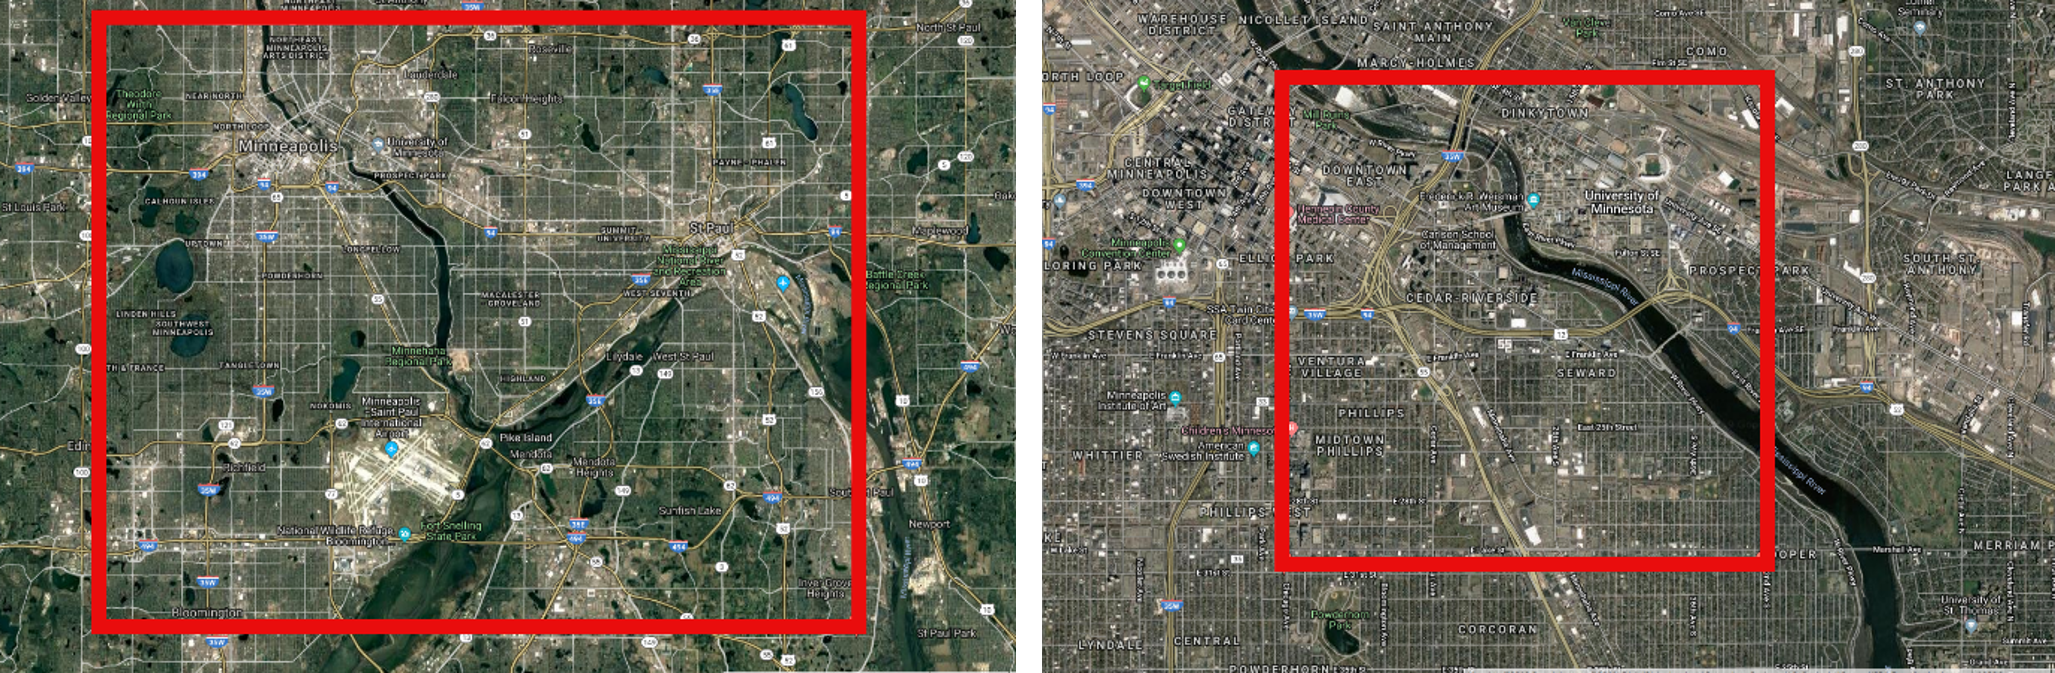
In addition to statewide projections, we also zoom into finer scales. This can help us both simulate changes at the golf course scale, and potentially predict how snow cover might change in typical winters by the end of the century. As an example of this finer scale modeling, Figure 3 shows our model domain for the Twin Cities Metro Area (TCMA) with the city centers of Minneapolis and St. Paul, and the University of Minnesota campus with bridges over the Mississippi river, respectively.
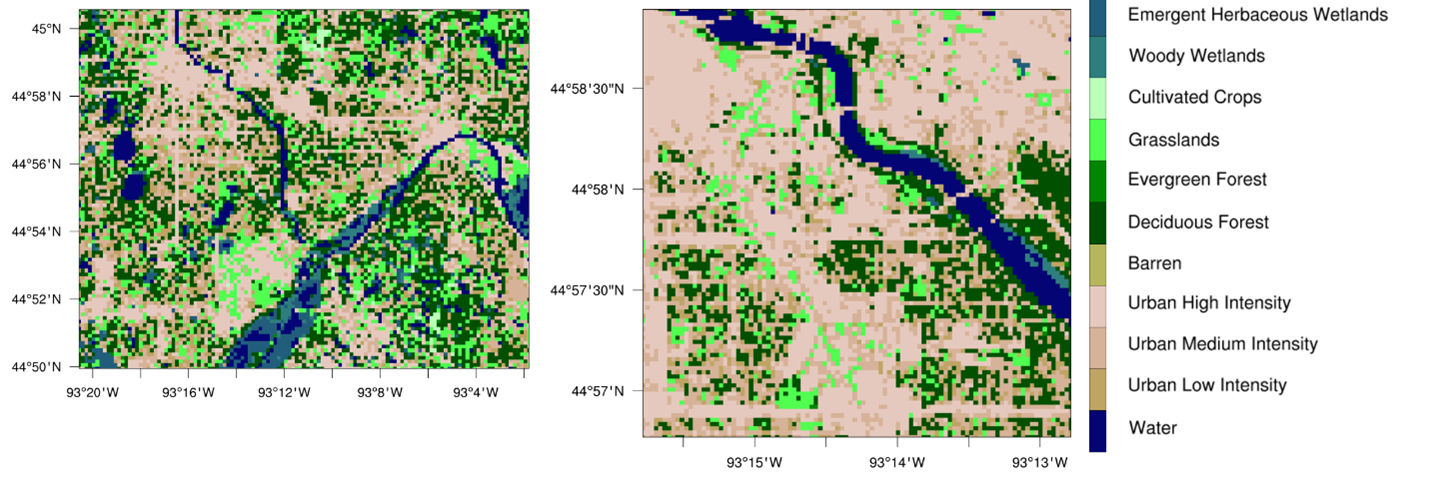
For these very high-resolution projections we use fine-scale land use inputs that can represent individual city blocks (Figure 4). We hope to not only support scientists understanding of current climate conditions, but to help prepare turfgrass managers and others for how a much warmer climate might affect conditions at their specific location.