By Marylee Murphy and Len Kne, U-Spatial, University of Minnesota
In the WinterTurf project, researchers are attempting to figure out the conditions that cause turfgrasses to die in the winter. One of the approaches we are using is to have golf course turfgrass managers help collect data on golf greens. To date, staff at more than 150 golf courses from around the world have volunteered to report conditions at their location throughout winter. They complete a suite of surveys that capture valuable information about one or more individual greens at their courses throughout the winter. In the beginning of the season, the participant fills out a pre-survey to document the condition of the green before the winter (Figure 1). Participants also record management activities including green covering, aeration, fertilizer, herbicide, and fungicide applications before the winter season. During the winter, they complete a weekly survey that includes a picture of the green and records the snow depth, observations, and any management activities that they have taken. More than 1,990 weekly surveys were completed in the 2022-2023 winter. The post-season survey captures the condition of the green at the end of the winter so we can determine if the green sustained any winter damage.
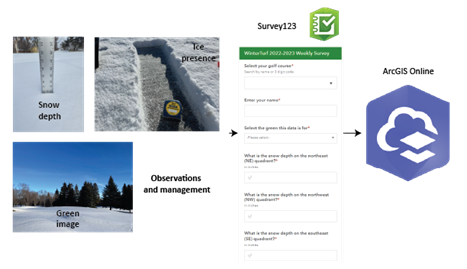
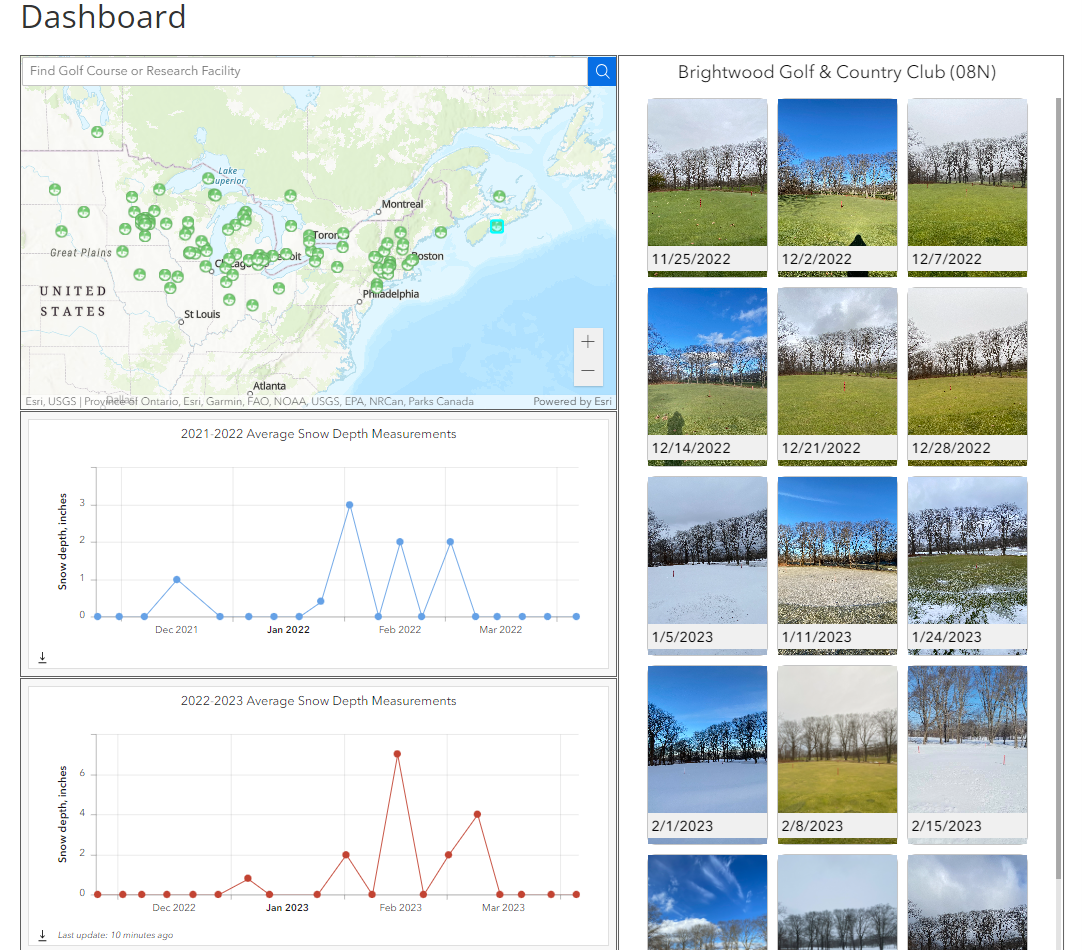
U-Spatial at the University of Minnesota constructed the surveys using Survey123, an ESRI product that allows creation of custom surveys that are easy for the participants to complete. The survey data is stored in ArcGIS Online and can be monitored, analyzed and manipulated by project staff, while allowing the survey participants the option of displaying their course snow depth and weekly images in a publicly available project dashboard created with ESRI’s ArcGIS Experience Builder and ArcGIS Dashboards products. The WinterTurf dashboard displays data in real-time (Figure 2). Survey data is one example of the information going into the centralized project database that is available to all researchers involved in the WinterTurf USDA-NIFA project. The data collected through these surveys will be used with other types of data (sensors, satellite imagery, etc.) to help make predictions about the environmental conditions under which turfgrass might die in the winter.